
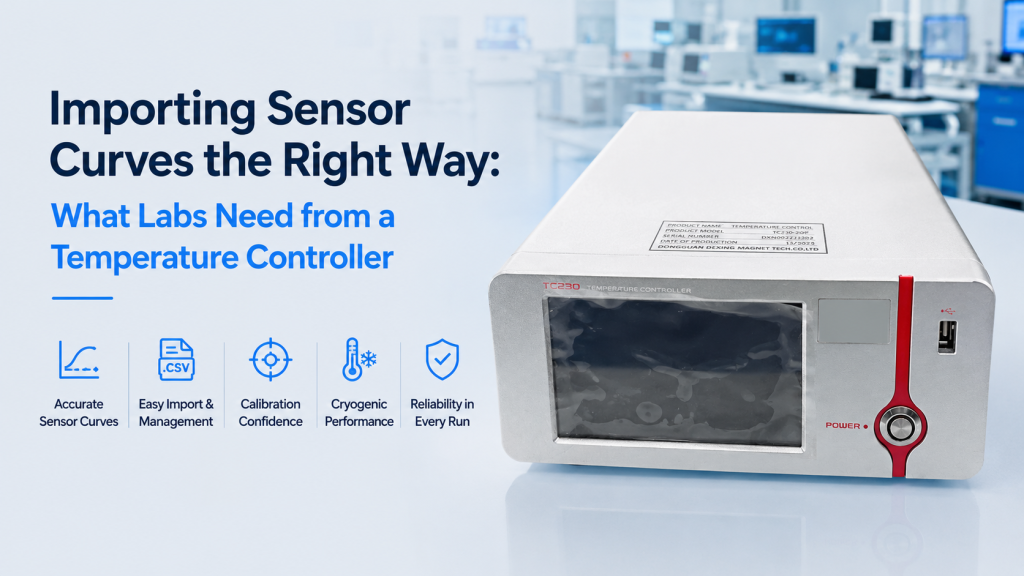
A cryogenic customer asks a seemingly simple question:
“Does your temperature controller support Cernox?”
The answer may be yes—but that answer is still incomplete.
In a real low-temperature experiment, “support” should mean much more than the controller being able to measure a resistance value from a Cernox sensor.
The laboratory may also need to:
- Import the calibration curve supplied with the exact sensor
- Store multiple user-defined sensor curves
- Assign different curves to different input channels
- Preserve the original calibration range and units
- Interpolate correctly between calibration points
- Verify that the imported curve produces the expected temperature
- Read the curve back from the instrument
- Back up curves before replacing a controller
- Manage curves remotely through software or an instrument interface
This matters because many cryogenic resistance thermometers are not perfectly interchangeable. NIST specifically notes that Cernox-type zirconium oxy-nitride resistance thermometers can have a broad range of resistance characteristics even within a model family, making calibration data important for accurate thermometry.
For buyers, the real question is therefore not:
“Does the controller support this sensor?”
It is:
“Can the controller correctly use the calibration data for our exact sensor throughout the temperature range that matters to our experiment?”
This guide explains what laboratories should check before purchasing a cryogenic temperature controller when custom sensor curves are part of the measurement chain.
1. What Is a Cryogenic Sensor Curve?
A temperature sensor does not necessarily output temperature directly.
A resistance thermometer, for example, produces an electrical resistance that changes with temperature.
The temperature controller must convert:
Resistance → Temperature
using a known relationship.
That relationship is the sensor curve.
For other sensor technologies, the electrical variable may instead be:
- Voltage
- Resistance
- Capacitance
- Thermoelectric voltage
The general measurement chain is:
Physical temperature → sensor electrical response → controller measurement → calibration curve → displayed temperature
The sensor curve therefore sits at the center of the conversion from an electrical measurement into a meaningful temperature value.
NIST cryogenic calibration procedures explicitly treat the resistance-versus-temperature relationship and its interpolation as part of cryogenic resistance thermometry. Calibration data may be represented through fitted functions or tabulated resistance and temperature values.
2. Why the Factory Sensor Type Is Only the First Step
A controller datasheet may say:
- Cernox supported
- Silicon diode supported
- Pt100 supported
- Pt1000 supported
- Ruthenium oxide supported
That statement describes the electrical input capability.
It does not necessarily tell you whether the controller can use the calibration supplied with your individual sensor.
Electrical Compatibility
The controller must be able to measure the sensor’s:
- Resistance or voltage
- Signal polarity
- Electrical range
- Required excitation
Calibration Compatibility
The controller must also know how to convert the measured electrical value into temperature.
These are related—but separate—requirements.
A controller can therefore be electrically compatible with a sensor and still be unsuitable for the desired accuracy if the correct calibration curve cannot be loaded.
3. Why Individual Curves Matter for Cryogenic Sensors
At room temperature, buyers are accustomed to sensors such as standard industrial RTDs, where standardized relationships may cover many applications.
Cryogenic thermometry can be different.
NIST describes Cernox-type zirconium oxy-nitride resistance thermometers as non-interchangeable devices that can exhibit a broad range of resistance characteristics for a given model.
That means two sensors carrying the same general product-family name should not automatically be assumed to produce identical resistance at every temperature.
For Routine Measurement
A generic or standard curve may sometimes provide sufficient performance, depending on the sensor and experiment.
For Higher-Accuracy Measurement
The laboratory may need the individual calibration supplied with the exact sensor.
This is why buyers should know whether their sensor is:
- Uncalibrated
- Supplied with a standard curve
- Individually calibrated
- Calibrated only over a limited temperature range
That information should be provided before the controller is selected.
4. The Sensor Serial Number Should Follow the Curve
One of the simplest laboratory-management practices can prevent serious mistakes:
Treat the sensor and its calibration file as one matched pair.
A useful record should connect:
- Sensor manufacturer
- Sensor model
- Sensor serial number
- Calibration date
- Calibration range
- Calibration file
- Controller curve slot
- Cryostat location
Why This Matters
Imagine a laboratory has five Cernox sensors.
All five calibration files are stored on the same computer.
Someone imports the wrong file into the controller.
The resistance measurement may still look completely reasonable.
The displayed temperature may also look reasonable.
But it may be wrong.
A sensor curve problem is particularly dangerous because it does not always produce an obvious instrument error.
5. “Can I Import the Calibration File?” Is the Better Procurement Question
Instead of asking:
“Does the controller support Cernox?”
ask:
“Can I load the individual calibration curve supplied with my Cernox sensor into the controller?”
Then continue with:
- Which file formats are accepted?
- Can the calibration be imported directly?
- Is conversion software required?
- Can the curve be edited?
- Can it be read back from the controller?
- How many user curves can be stored?
Commercial cryogenic instrumentation demonstrates why these are reasonable questions. Lake Shore provides Curve Handler software specifically for uploading temperature curve files to compatible temperature instruments, reading curves back from instruments, editing them, and saving them again.
The important procurement concept is not the particular software brand.
It is curve lifecycle management.
6. Direct Import Is Better Than Manual Re-Entry
Some calibration curves may contain many points.
Entering them manually creates opportunities for:
- Typing errors
- Decimal-point mistakes
- Unit mistakes
- Missing rows
- Reversed columns
- Incorrect temperature values
Where possible, laboratories should prefer:
Calibration file → validated conversion/import → controller
rather than:
Printed calibration table → manual typing → controller
Manual entry may still be acceptable for small datasets, but every entered value should then be independently verified.
7. File Format Compatibility Must Be Checked
A sensor manufacturer may provide calibration data in one format while the controller expects another.
Possible differences include:
- Plain text
- CSV
- Proprietary curve format
- Resistance–temperature tables
- Temperature–resistance tables
- Coefficient-based calibration data
The buyer should not assume that:
“Both are digital files”
means:
“They can be imported directly.”
Ask the Controller Supplier
- Which formats are accepted?
- Is conversion software provided?
- Can standard CSV data be converted?
- Is the conversion process documented?
- Can the resulting curve be inspected before upload?
The goal is to make the transfer traceable and repeatable.
8. Column Order Can Cause Silent Errors
A simple calibration table may contain:
| Temperature | Resistance |
|---|---|
| T1 | R1 |
| T2 | R2 |
| T3 | R3 |
Another system may expect:
| Resistance | Temperature |
|---|---|
| R1 | T1 |
| R2 | T2 |
| R3 | T3 |
If software handles the conversion automatically, this may be trivial.
If the user manually creates a file, it becomes a potential error source.
Verification Step
After import, check several known calibration points:
- Near the low-temperature end
- Near the middle
- Near the high-temperature end
The displayed temperature should correspond to the expected electrical value.
Never assume that a successful file upload proves the curve itself is correct.
9. Units Must Be Defined Explicitly
Calibration files may use electrical quantities expressed in different units.
For example:
- Ω
- kΩ
- mV
- V
Temperature may be represented as:
- K
- °C
Cryogenic controllers normally work naturally in kelvin for low-temperature applications, but a laboratory should still verify the expected format.
A Unit Error Can Be Catastrophic
Suppose the sensor resistance is:
5 kΩ
and the curve importer interprets:
5
as:
5 Ω.
The file may still be syntactically valid.
The resulting temperature conversion will not be.
Procurement Question
Does the curve-management software:
- Validate units?
- Display the imported range?
- Warn about out-of-range data?
- Allow the user to preview the curve?
These are valuable features.
10. Check the Calibration Range Before Importing
Suppose a sensor has been calibrated from:
4 K to 100 K.
The controller itself may be capable of reading the sensor from:
1.5 K to 300 K.
That does not mean the individual calibration remains valid across the controller’s entire electrical range.
Three Different Ranges Must Be Separated
Sensor operating range
Where the sensor can physically function.
Controller input range
Where the instrument can electrically measure it.
Calibration range
Where the supplied temperature conversion is valid.
These ranges are not automatically identical.
A controller should not encourage users to confuse extrapolated temperature values with calibrated measurements.
11. Interpolation Matters Between Calibration Points
A sensor calibration cannot contain measured data at every infinitely small temperature increment.
The controller therefore needs to determine temperatures between known calibration points.
This is interpolation.
NIST explains that calibrated cryogenic resistance thermometers use interpolation functions or tabulated calibration data to derive temperature from measured resistance between calibration points. The appropriate representation can involve different fitting functions or subranges depending on the sensor and temperature range.
Why Buyers Should Care
A temperature controller is not simply storing a lookup table.
It must convert measurements between the stored points in a predictable way.
For normal laboratory use, the instrument handles this internally.
But when high accuracy matters, laboratories should know:
- How user curves are interpolated
- Whether curve spacing is sufficient
- Whether interpolation introduces additional uncertainty
- Whether the imported format preserves the original calibration adequately
12. More Curve Points Are Not Automatically Better
It is tempting to think:
“More points = more accurate temperature.”
Not necessarily.
Adding artificial points between real calibration measurements does not create additional calibration information.
A dense curve generated from a poor fit is still a poor curve.
NIST emphasizes that calibration interpolation should be fitted only to the degree necessary to represent the calibration data within the relevant uncertainties; unnecessarily increasing fitting complexity does not automatically improve the underlying measurement.
What Matters More
- Quality of calibration
- Appropriate interpolation
- Coverage of the required temperature range
- Correct curve conversion
- Correct sensor assignment
The controller should preserve the calibration—not decorate it with unnecessary numerical density.
13. Extrapolation Beyond the Curve Is a Different Problem
Interpolation estimates values between calibration points.
Extrapolation estimates values outside the calibrated range.
These should not be treated as equivalent.
Suppose the lowest calibrated temperature is:
4 K.
The laboratory then operates at:
2 K.
The controller may still generate a displayed value depending on its implementation.
But that number is not automatically supported by the original calibration.
Buyers Should Ask
What happens when the measured sensor signal lies outside the imported curve?
Does the controller:
- Display an error?
- Clamp to the curve endpoint?
- Extrapolate?
- Continue with reduced confidence?
- Switch to another curve?
For critical experiments, this behavior should be understood before use.
14. Curve Direction Matters for PTC and NTC Sensors
Temperature sensors can exhibit different response directions.
PTC Sensor
Resistance increases with temperature.
NTC Sensor
Resistance decreases as temperature increases.
Many cryogenic resistance thermometers are NTC devices.
NIST classifies Cernox-type zirconium oxy-nitride sensors as NTC thermometers.
The controller or curve importer therefore needs to interpret the relationship correctly.
If curve direction or ordering requirements exist in the file format, they should be documented.
15. One Sensor Input May Need Several Possible Curves
A flexible cryogenic laboratory may change sensors frequently.
For example:
Experiment A
Cernox sensor
Experiment B
Silicon diode
Experiment C
Pt RTD
The same controller input may therefore need to work with different sensor curves at different times.
A Useful Controller Should Make It Easy to
- Select a sensor type
- Select a calibration curve
- Change curves without deleting others
- Confirm which curve is active
- Associate the correct curve with the correct input
This sounds like a software detail.
In a multi-user laboratory, it becomes a data-quality issue.
16. Different Inputs May Need Different Curves Simultaneously
Consider a cryostat with:
- Cernox sensor on the sample
- Silicon diode on the cold head
- Pt100 on the radiation shield
The controller may need three different temperature conversions at the same time.
A buyer should therefore ask:
- Can each sensor input use an independent curve?
- Are all required sensor electrical types supported simultaneously?
- Does changing one input affect another?
- How clearly does the display identify each channel?
“Four sensor inputs” is not enough information.
17. Curve Storage Capacity Matters in Shared Laboratories
A single-user system may have one permanent sensor.
Curve storage capacity is almost irrelevant.
A university shared laboratory may have:
- Several cryostats
- Multiple removable sample holders
- Replacement sensors
- Different research projects
- Spare calibrated thermometers
Now user-curve storage becomes much more valuable.
Buyers Should Estimate
How many individually calibrated sensors will this controller realistically need to support over its lifetime?
You do not necessarily need enormous curve memory.
But having enough named curve slots can prevent repeated deletion and re-importing.
18. Curve Names Should Be Meaningful
Avoid names such as:
- CURVE1
- CURVE2
- TEMP3
when the system allows something clearer.
A better laboratory convention might include:
- CX1050_SN12345
- SAMPLE_STAGE_A
- DIODE_COLDHEAD_02
The exact naming convention depends on controller limitations.
The objective is simple:
An operator should be able to identify the active calibration without opening a separate notebook.
19. Readback Is an Underrated Feature
Importing a curve is only half the job.
A good workflow should also allow the laboratory to verify what is currently stored in the controller.
Lake Shore’s Curve Handler, for example, supports both uploading curves and reading temperature curves back from compatible instruments.
Why Readback Matters
It allows you to:
- Verify that the upload succeeded
- Compare stored and original files
- Recover a curve from an older controller
- Audit laboratory configurations
- Transfer a curve when replacing equipment
This is particularly valuable years after installation, when the original engineer may no longer be working in the laboratory.
20. Back Up Sensor Curves Outside the Instrument
Never let the only copy of a calibrated sensor curve live inside a temperature controller.
Maintain an external archive containing:
- Original calibration certificate
- Original calibration file
- Converted controller file
- Sensor serial number
- Import date
- Instrument model
- Curve slot
- Any conversion notes
Recommended Principle
The controller contains the working copy.
Your laboratory records contain the master copy.
If the controller fails or is replaced, the calibration should not disappear with it.
21. Keep the Original Calibration File
Do not overwrite the original manufacturer or calibration-laboratory file during conversion.
Use separate files such as:
- Original calibration
- Converted controller curve
- Verified uploaded copy
This creates a traceable chain.
If a result is questioned later, the laboratory can determine:
- What calibration was supplied
- How it was converted
- What was actually loaded
That is especially important for publication-quality work and shared facilities.
22. A Calibration Certificate Is Not Always an Import File
A sensor may arrive with a calibration certificate containing:
- Calibration points
- Uncertainty
- Sensor identification
- Calibration conditions
That does not necessarily mean the document can be loaded directly into the controller.
The controller may require a separate digital curve file.
Before Purchase, Confirm
Will the sensor supplier provide:
- Printed certificate only?
- PDF certificate?
- Digital R–T table?
- Controller-compatible curve file?
- Fitting coefficients?
If only a PDF is supplied, manual or software conversion may be necessary.
23. Do Not Re-Type a PDF Unless You Have To
Calibration certificates sometimes contain tables that users manually copy into spreadsheets.
That works—but introduces risk.
Potential errors include:
- Missing decimal places
- Transposed digits
- Skipped rows
- Wrong unit conversion
- Wrong sensor serial number
If digital calibration data are available, use them.
If manual entry is unavoidable:
- Use independent verification
- Compare several points with the certificate
- Save the entered table separately
- Record who performed the conversion
Calibration management is part of measurement quality.
24. Curve Compatibility Does Not Replace Input Compatibility
A controller may allow arbitrary user curves.
That does not mean it can measure every sensor.
The electrical input must still support the sensor.
Resistance Sensor
Check:
- Resistance range
- Excitation current or voltage
- Input resolution
- Four-wire capability
Diode Sensor
Check:
- Required excitation current
- Voltage range
Thermocouple
Check:
- Voltage input
- Reference compensation requirements
A user-defined curve cannot solve an incompatible electrical input.
25. Excitation Must Match the Calibration Conditions
For cryogenic resistance sensors, electrical excitation itself can influence measurement.
Excessive excitation can cause self-heating, making the sensor slightly warmer than its environment.
NIST discusses excitation conditions and self-heating as part of cryogenic resistance thermometer calibration and measurement.
Therefore, curve import should not be treated separately from sensor excitation.
Buyer Questions
- What excitation does the controller use with this sensor?
- Is excitation selectable?
- What excitation was used for calibration?
- Is self-heating significant at the lowest temperature?
A perfect curve cannot correct a sensor being electrically heated above the actual sample temperature.
26. Magnetic Field Can Add Another Layer of Calibration Complexity
Cryogenic sensors are frequently used inside:
- Electromagnets
- Superconducting magnets
- Hall measurement systems
- VSM systems
- MOKE systems
Sensor response may depend on magnetic field to varying degrees depending on technology and operating conditions.
NIST identifies Cernox-type thermometers as particularly relevant for high-magnetic-field applications, one reason they are widely used in cryogenic magnetic experiments.
Important Distinction
A zero-field calibration curve tells you the sensor’s temperature relationship under its calibration condition.
It does not automatically remove every field-dependent error in your actual experiment.
When magnetic-field accuracy matters, buyers should specify:
- Maximum field
- Sensor type
- Sensor location
- Required temperature accuracy in field
Curve support is only one part of the problem.
27. The Controller Should Make the Active Curve Obvious
A dangerous user-interface problem occurs when the operator cannot easily tell which curve is assigned to which input.
Before measurement, users should be able to confirm:
- Input A → Sample Cernox SN xxxx
- Input B → Cold-head diode
- Input C → Shield RTD
If this information is buried deeply in menus, shared laboratories become more vulnerable to configuration mistakes.
Good Practice
Include a pre-experiment check:
- Correct sensor
- Correct curve
- Correct excitation
- Correct measurement range
- Correct units
This takes seconds and can save an entire experiment.
28. Curve Changes Should Be Controlled in Multi-User Laboratories
Imagine 20 researchers sharing one cryogenic system.
One user replaces a sensor and uploads a new curve.
Another user returns the next day and assumes the old configuration still exists.
This is not a hardware failure.
It is a configuration-management failure.
Useful Laboratory Practices
- Record curve changes
- Use standardized curve names
- Save controller configurations
- Restrict curve editing where appropriate
- Maintain a sensor/curve register
As instruments become more configurable, software discipline becomes more important.
29. Remote Curve Management Can Matter for Automated Systems
Most experiments do not need to modify curves during measurement.
But remote access can be useful for:
- Initial setup
- Multi-cryostat laboratories
- Instrument replacement
- Configuration backup
- Automated test stations
Lake Shore’s Curve Handler demonstrates one implementation where computer software can upload, read, edit, and save sensor curves for compatible instruments.
For procurement, ask whether curve functions are available through:
- Manufacturer software
- Remote commands
- Ethernet
- USB
- GPIB
- Serial communication
The connector alone is less important than the actual commands exposed through it.
30. Ask Whether Curves Survive Power Cycling
A user curve should normally remain stored after:
- Instrument restart
- Power failure
- System shutdown
But laboratories should verify this rather than assume it.
Also ask what happens after:
- Factory reset
- Firmware update
- Configuration restore
- Controller replacement
The laboratory should know which operations can erase user calibration information.
This reinforces the importance of external backups.
31. What Happens When You Replace the Sensor?
A temperature sensor may eventually be:
- Damaged
- Recalibrated
- Moved to another cryostat
- Replaced
Do not simply install a new sensor and continue using the old curve.
Replacement Workflow
- Record the old sensor serial number.
- Install the new sensor.
- Confirm electrical compatibility.
- Obtain the new sensor calibration.
- Import the correct curve.
- Assign it to the appropriate input.
- Verify several points if possible.
- Update laboratory records.
The physical connector may be identical.
The calibration may not be.
32. Recalibration Means the Curve May Need Updating
A sensor can be recalibrated after extended use or when higher traceability is required.
The new calibration may differ slightly from the old one.
Therefore:
Sensor serial number alone is not always enough.
Your records may also need:
- Calibration date
- Calibration revision
- Curve-file version
A simple naming convention can prevent old calibration data from being accidentally reused.
33. Verify the Curve After Import
Do not stop when the software says:
“Upload successful.”
Perform a basic verification.
Check the Metadata
- Sensor name
- Serial number
- Units
- Temperature range
Check Electrical Endpoints
Confirm that the lowest and highest stored electrical values make sense.
Check Several Calibration Points
Select known electrical values from the original calibration and confirm that the controller converts them to approximately the expected temperature.
Check Real Sensor Behavior
If the sensor is installed in a known environment, verify that the reading is physically plausible.
A successful import is a file-transfer result.
A successful verification is a thermometry result.
34. Compare the Raw Sensor Value Too
When troubleshooting a strange temperature reading, do not look only at temperature.
Display or record the raw sensor quantity if the controller permits it.
For example:
- Resistance
- Voltage
Why This Helps
Suppose the displayed temperature is wrong.
If the measured resistance is correct:
the problem may be:
- Curve
- Curve assignment
- Units
- Conversion
If the measured resistance itself is wrong:
the problem may instead be:
- Wiring
- Excitation
- Contact
- Sensor
- Input configuration
This separation makes troubleshooting much faster.
35. A Wrong Curve Can Look Like a Thermal Problem
Imagine a sample suddenly appears to be:
8 K warmer than expected.
Users may start checking:
- Cryocooler
- Vacuum
- Heater
- Thermal contact
But if the wrong sensor curve is loaded, the thermal system may be working perfectly.
Troubleshooting Order
Before dismantling the cryostat, confirm:
- Sensor model
- Sensor serial number
- Raw electrical reading
- Active calibration curve
- Curve range
- Input configuration
Configuration errors are cheaper to investigate than hardware failures.
36. A Wrong Curve Can Also Affect PID Control
The risk becomes more serious when the sensor is not merely monitored but used for closed-loop control.
Suppose the curve converts the sensor signal incorrectly.
The controller believes the sample is:
20 K
when it is actually:
23 K.
The PID loop can be perfectly stable around the wrong interpreted temperature.
Important Principle
Good PID stability does not prove good temperature accuracy.
The control loop trusts the sensor conversion provided to it.
Therefore, the curve used on a control sensor deserves even stricter verification than a monitoring-only curve.
37. Temperature Stability and Curve Accuracy Are Separate
This distinction matters in system specifications.
A controller may hold its displayed temperature at:
20.000 ±0.005 K
with excellent stability.
If the sensor curve is incorrect, the true sample temperature may still be offset.
Stability
How much the indicated temperature changes with time.
Calibration Accuracy
How correctly the sensor signal corresponds to true temperature.
You need both when absolute temperature matters.
Curve import primarily affects the second.
38. Standard Curves Still Have a Useful Role
This article should not be interpreted as:
“Every cryogenic sensor always requires an individual curve.”
That would be too broad.
Depending on sensor family, accuracy target, temperature range, and application, a standard response curve may be adequate.
Standard Curves Can Be Useful For
- General monitoring
- Commissioning
- Less demanding experiments
- Interchangeable sensor families within their intended accuracy
Individual Calibration Is More Valuable When
- Absolute accuracy matters
- The sensor family is not sufficiently interchangeable
- The experiment covers a demanding cryogenic range
- Published data require stronger traceability
The correct choice should follow the uncertainty requirement.
39. Calibration Range Should Match the Scientific Range
Suppose a laboratory plans measurements only between:
20 K and 100 K.
It may not need premium calibration from:
0.3 K to 400 K.
Conversely, a calibration ending at:
20 K
does not meet a project requiring:
4 K measurements.
Procurement Strategy
Define:
- Minimum measurement temperature
- Maximum measurement temperature
- Critical accuracy regions
Then purchase:
- Sensor
- Calibration
- Controller input
as a matched chain.
Do not independently maximize each specification.
40. Curve Support Is Especially Important for Multi-Sensor Cryogenic Systems
A complex system may contain:
- Sample Cernox
- Cold-head diode
- Shield Pt100
- Magnet Cernox
- Backup resistance thermometer
Now the controller or temperature monitor may need to manage several sensor-response types simultaneously.
Ask Before Purchase
- How many user curves can be stored?
- Can every input use its own curve?
- Which electrical sensor types can operate simultaneously?
- Can curves be renamed?
- Can curves be exported?
- Can configurations be backed up?
These questions reveal far more than the generic phrase:
“Multi-sensor support.”
41. A Temperature Monitor Needs Curve Management Too
Do not assume this topic applies only to controllers.
A cryogenic temperature monitor also converts sensor signals into temperature.
Therefore, it may need:
- User calibration curves
- Independent channel assignments
- Curve storage
- Curve backup
- Remote readback
The heater and PID sections are absent.
The thermometry requirements remain.
42. Ask About Curves Before Buying the Sensors Too
Sometimes the purchasing sequence is backwards.
A laboratory buys:
- Six calibrated sensors
and only later asks:
“Which controller can read them?”
A better sequence is to evaluate together:
- Sensor
- Calibration format
- Controller input
- Curve-management capability
- Cryostat wiring
This avoids discovering after purchase that a desired calibration cannot be loaded easily into the selected instrument.
43. A Weak Sensor-Curve RFQ
A buyer writes:
“We need a cryogenic temperature controller that supports Cernox.”
The supplier still does not know:
- Exact Cernox model
- Number of sensors
- Temperature range
- Individually calibrated or not
- Curve file available or not
- Magnetic field
- Monitor or control
- Heater requirements
The word “support” hides too many assumptions.
44. A Better Sensor-Curve RFQ
“We have two individually calibrated Cernox resistance thermometers for measurements between approximately 4 K and 300 K. Each sensor is supplied with its own calibration data. We need the controller to allow user calibration curves to be imported and stored independently for each input. Please confirm the accepted curve format, curve upload/readback method, supported resistance and excitation ranges, and whether the calibration curves can be backed up through the computer interface. One sensor will be used for closed-loop temperature control and the second for independent monitoring.”
Now the supplier can evaluate:
- Electrical input
- Curve compatibility
- Sensor excitation
- User-curve management
- Control requirement
- Software interface
That is a technically useful inquiry.
45. What Buyers Should Ask About Sensor Curve Import
Before purchasing a cryogenic temperature controller or monitor, ask:
Sensor Compatibility
- Is the exact sensor type electrically supported?
- What resistance or voltage range is supported?
- What excitation is used?
Curve Import
- Can user-defined calibration curves be imported?
- Which file formats are supported?
- Is conversion software provided?
- Can CSV or tabulated calibration data be converted?
Curve Capacity
- How many user curves can be stored?
- Can each input use a different curve?
Curve Validation
- Can imported curves be previewed?
- Are range or formatting errors detected?
- What happens outside the curve range?
Curve Management
- Can curves be renamed?
- Can they be read back from the instrument?
- Can they be saved to a computer?
- Do they remain after power cycling?
- What happens after a factory reset or firmware update?
Traceability
- Can the sensor serial number be recorded?
- Can the calibration revision be documented?
Integration
- Can curve functions be accessed remotely?
- Is an API or command set available?
If these questions are answered, “supports Cernox” becomes a much more meaningful statement.
46. How Cryomagtech Approaches Sensor and Temperature Controller Compatibility
Cryomagtech evaluates cryogenic temperature instrumentation as a complete chain:
Sensor → excitation → electrical input → calibration curve → temperature reading → control loop
Depending on the project, the review may include:
- Cernox and other cryogenic sensor types
- Resistance or voltage input range
- Measurement excitation
- Sensor self-heating
- Individual calibration data
- User-defined sensor curves
- Multiple sensor channels
- Curve assignment and storage
- Temperature monitoring
- PID temperature control
- Heater resistance and power
- Magnetic-field environment
- Computer communication and data acquisition
For customers who already own calibrated sensors, providing the exact sensor model and calibration file format before quotation can prevent unnecessary uncertainty later.
The important question is not whether a sensor name appears in the controller’s compatibility list.
It is whether the full sensor calibration can be used correctly in the real experiment.
47. Key Takeaways
- A cryogenic sensor curve converts the electrical response of a sensor into temperature.
- Electrical sensor compatibility and calibration-curve compatibility are different requirements.
- Some cryogenic resistance thermometers, including Cernox-type sensors, are not perfectly interchangeable, so individual calibration data can matter.
- A controller should ideally support importing, storing, assigning, verifying, reading back, and backing up user curves.
- File format, column order, units, curve range, and interpolation all need to be handled correctly.
- Interpolation within a calibrated range is different from extrapolation beyond that range.
- More curve points do not automatically create better calibration.
- Each sensor should remain linked to its own serial number and calibration record.
- The original calibration file should be preserved separately from any converted controller file.
- A successful upload does not prove the imported curve is correct—verification is still required.
- Raw sensor resistance or voltage is extremely useful when diagnosing curve problems.
- A wrong calibration curve can create a stable but incorrect temperature reading.
- A wrong curve on the PID control sensor can cause the system to regulate precisely around the wrong interpreted temperature.
- Temperature monitors need curve-management capability too, even though they do not drive heaters.
- “Supports Cernox” is only useful when the supplier can explain exactly what support means.
The weak question is:
“Does this controller support Cernox?”
The better question is:
“Can I import, verify, store, and retrieve the calibration curve for my exact sensor—and will the controller measure that sensor correctly over my required temperature range?”
References
- National Institute of Standards and Technology (NIST) — Calibration of Cryogenic Resistance Thermometers Between 0.65 K and 83.8058 K
NIST discusses individual cryogenic thermometer behavior, calibration, interpolation functions, calibration tables, excitation conditions, and the characteristics of Cernox-type zirconium oxy-nitride resistance thermometers.
https://nvlpubs.nist.gov/nistpubs/SpecialPublications/NIST.SP.250-91.pdf - Lake Shore Cryotronics — Curve Handler
Lake Shore’s official curve-management software illustrates practical functions laboratories should look for: uploading temperature curves to instruments, reading curves back, editing curve information, and saving curves to files.
https://www.lakeshore.com/resources/software/curve-handler