
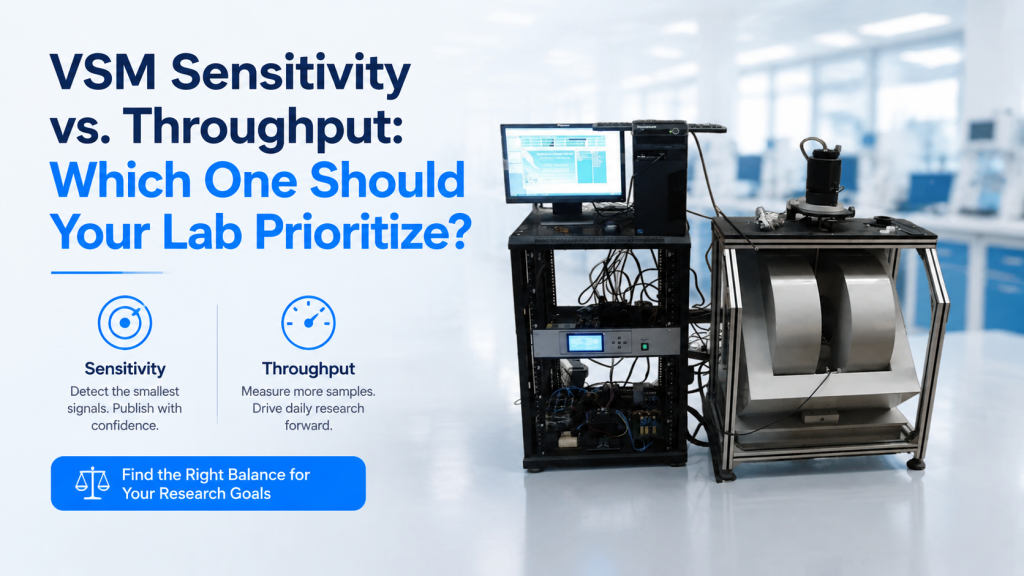
When laboratories compare Vibrating Sample Magnetometers, they often ask for two things at the same time:
- The lowest possible magnetic-moment detection limit
- the fastest possible sample measurement
Both are reasonable goals.
But they are not always achieved under the same operating conditions.
A low-moment thin film may require careful sample centering, a clean holder background, longer signal averaging, smaller magnetic-field steps, repeated measurements, and more conservative data processing.
A production or materials-screening laboratory may care more about:
- Fast sample exchange
- automatic centering
- short field sweeps
- repeatable measurement recipes
- batch reports
- reliable pass/fail decisions
- several completed samples per day
This creates an important procurement question:
Should your laboratory prioritize VSM sensitivity or VSM throughput?
The correct answer depends on the samples, expected magnetic moments, research decisions, measurement sequences, temperature range, user base, and acceptable uncertainty.
It is also possible that the laboratory does not need to choose one extreme.
A properly configured VSM may provide:
- A fast screening mode for routine samples
- a balanced research mode for normal publications
- a high-sensitivity mode for weak or difficult samples
This article explains how to evaluate VSM sensitivity vs throughput and choose a system configuration that matches the laboratory’s real workload instead of purchasing every available specification.
1. Sensitivity and Throughput Answer Different Questions
Sensitivity asks:
How weak a magnetic moment can the system measure with useful confidence?
Throughput asks:
How many valid sample results can the laboratory complete within a defined period?
A system may produce data points very quickly but still have low daily throughput because:
- Sample mounting takes too long.
- centering is manual.
- the holder background must be measured repeatedly.
- the magnet takes time to settle.
- cryogenic sample exchange is slow.
- users need to rebuild measurement sequences.
- failed measurements are discovered only after the run.
The laboratory should therefore compare complete measurement workflows—not only brochure numbers.
2. Define VSM Sensitivity Correctly
VSM sensitivity may be described using terms such as:
- Minimum detectable magnetic moment
- noise floor
- moment resolution
- signal-to-noise ratio
- repeatability
- measurement uncertainty
These terms are related but are not identical.
Minimum Detectable Moment
The smallest sample signal that can be distinguished under defined measurement conditions.
Noise Floor
The apparent magnetic-moment fluctuation when no meaningful sample signal is present.
Resolution
The smallest displayed or distinguishable change in magnetic moment.
Signal-to-Noise Ratio
The sample signal divided by the relevant noise level.
Repeatability
The agreement between repeated measurements under the same conditions.
Remounting Reproducibility
The agreement after the sample is removed, reinstalled, and re-centered.
A quotation should not combine all these properties into one unsupported “sensitivity” value.
3. Define VSM Throughput Correctly
Throughput should not be defined only as points per second.
A more useful definition is:
VSM throughput = the number of samples that can be mounted, measured, validated, processed, and reported within a specified working period.
The full workflow may include:
- Prepare the sample.
- select the holder.
- mount the sample.
- enter sample information.
- install the holder.
- center the sample.
- measure the holder or substrate background.
- run the field sequence.
- check data quality.
- repeat questionable points.
- normalize the result.
- export the report.
- remove the sample.
- prepare the next measurement.
A faster detector does not automatically shorten every step.
4. The Real Trade-Off Is Often Signal Quality vs. Measurement Time
For weak magnetic moments, laboratories may improve data quality through:
- Longer averaging
- narrower measurement bandwidth
- more repeated readings
- slower magnetic-field sweeps
- additional field-settling time
- more background measurements
- improved mechanical stability
- repeated sample centering
These steps can reduce the number of samples completed per day.
Lake Shore has published VSM measurements showing how different averaging times influence measured noise and the usability of weak-moment sample data. The practical lesson is that sensitivity must be stated together with the averaging and measurement conditions used to obtain it.
5. Sensitivity Should Be Based on the Weakest Real Sample
The buyer should estimate the expected magnetic-moment range before requesting the most sensitive available system.
For each sample class, record:
- Sample type
- magnetic material
- dimensions
- magnetic volume
- mass
- expected magnetization
- expected maximum moment
- expected minimum moment
- substrate or holder background
- required field
- required temperature
A simple estimate may use:
Magnetic moment = magnetization × magnetic volume
or:
Magnetic moment = specific magnetization × sample mass
The estimate does not need to be perfect.
Its purpose is to determine whether the laboratory needs:
- Microemu-level measurement
- sub-microemu measurement
- nanoemu-level research capability
- a larger-signal routine measurement range
6. Do Not Purchase Sensitivity Without a Signal-to-Noise Target
A sample signal equal to the quoted noise floor is not automatically a useful measurement.
The buyer should define an acceptable signal-to-noise ratio.
For example:
- SNR ≥ 3 for basic detection
- SNR ≥ 5 for screening
- SNR ≥ 10 for routine quantitative comparison
- a higher target for subtle loop features or publication-quality analysis
These numbers are project decisions, not universal acceptance rules.
The required SNR depends on whether the laboratory needs to:
- Detect whether magnetism is present
- compare samples
- calculate coercivity
- fit high-field behavior
- subtract a large substrate background
- identify a small exchange-bias shift
- compare data across temperature
7. A Low Noise Floor Is Not Enough
A sensitivity claim should state:
- Averaging time
- measurement bandwidth
- sample holder
- pickup-coil configuration
- vibration amplitude
- vibration frequency
- pole gap
- magnetic field
- temperature
- environmental condition
- background-subtraction method
- noise calculation method
Without these conditions, competing sensitivity specifications may not be comparable.
A buyer should also ask whether the quoted value represents:
- Typical performance
- best observed performance
- guaranteed performance
- an empty-holder measurement
- a reference-sample measurement
- room-temperature performance only
8. Resolution Is Not the Same as Sensitivity
A system may report many decimal places while the real measurement fluctuates by a much larger amount.
For example, software may display moment changes smaller than:
- Mechanical noise
- holder background
- environmental vibration
- sample-position error
- magnetic-field instability
The number of displayed digits should not be used as the primary sensitivity specification.
Buyers should request raw repeated data and calculate practical noise and repeatability.
9. Repeatability May Matter More Than the Lowest Detectable Signal
A laboratory comparing process batches may not need the smallest possible magnetic-moment detection limit.
It may need to know that:
- The same sample gives the same answer.
- different operators obtain comparable results.
- the holder returns to the same position.
- the system remains stable throughout the week.
- the analysis uses the same settings for every batch.
For screening, repeatability can be more valuable than extreme sensitivity.
A system with a slightly higher noise floor but excellent holder reproducibility and automated centering may produce more dependable routine decisions.
10. Remounting Reproducibility Is a Throughput Specification
Many sensitivity tests are performed without removing the sample.
Daily laboratories repeatedly:
- Remove samples
- install new samples
- change holders
- re-center the measurement
- enter new dimensions
- subtract new backgrounds
A practical acceptance test should include:
- Measure a reference sample.
- remove the sample.
- reinstall it.
- repeat the centering process.
- repeat the hysteresis loop.
- compare moment, coercivity, remanence, and loop shape.
This test reveals the combined performance of:
- Holder design
- sample mounting
- centering
- software
- operator workflow
- measurement repeatability
11. Sample Centering Links Sensitivity and Throughput
The measured VSM signal depends on the sample’s position relative to the pickup coils.
Poor centering can cause:
- Reduced measured moment
- inconsistent results
- distorted comparison between samples
- additional background
- repeated measurements
- wasted operator time
A sensitivity-focused workflow may repeat centering until the optimum signal is obtained.
A throughput-focused workflow needs centering that is:
- Fast
- automated where possible
- repeatable
- easy for different users
- recorded with the measurement
The RFQ should ask how long centering normally takes for:
- Strong bulk samples
- weak thin films
- powders
- cryogenic holders
- high-temperature holders
12. Weak Samples May Be Difficult to Center Automatically
Automatic centering normally requires a detectable signal.
For very weak samples, the system may need:
- A longer centering scan
- more averaging
- a different gain range
- a known reference position
- a holder-based mechanical stop
- manual confirmation
Buyers should ask whether the automatic centering function works at the weakest expected sample moment.
A function demonstrated with a strong nickel sample may behave differently with an ultra-thin magnetic film.
13. Holder Background Can Determine the Practical Sensitivity
For low-moment samples, the holder may produce a signal comparable to or larger than the sample.
Possible background sources include:
- Adhesive
- tape
- capsule
- sample cup
- substrate
- holder material
- contamination
- magnetic fasteners
- temperature-dependent holder response
The practical measurement limit depends on the ability to characterize and subtract this background.
A low instrument noise floor cannot compensate for an unstable or poorly characterized sample holder.
14. Background Measurement Reduces Throughput
A high-quality weak-moment workflow may require:
- Empty-holder measurement
- blank-substrate measurement
- empty-capsule measurement
- adhesive-only measurement
- holder measurement at each temperature
- repeated background verification
These steps consume time.
The laboratory should decide whether every sample requires an individual background or whether a controlled holder library can be reused.
Reusable background files may improve throughput only when:
- Holders are stable.
- positioning is repeatable.
- mounting materials are controlled.
- temperature history is known.
- background drift is monitored.
15. Thin Films Usually Favor Sensitivity
Thin magnetic films often contain a small amount of magnetic material.
The sample signal may be affected by:
- Substrate diamagnetism
- holder background
- film-thickness uncertainty
- mounting position
- in-plane or out-of-plane orientation
- edge contamination
- sample-area uncertainty
A thin-film research laboratory may reasonably prioritize:
- Low noise
- high centering accuracy
- background subtraction
- stable field
- long averaging options
- reliable raw-data access
- repeatable in-plane and out-of-plane holders
For these laboratories, the number of samples per day may be less important than the ability to obtain defensible data from weak moments.
16. Nanoparticles and Low-Mass Powders May Also Favor Sensitivity
Powder samples may produce weak signals when:
- Sample mass is limited.
- material availability is low.
- magnetic concentration is small.
- the powder is dispersed in a nonmagnetic matrix.
- sealed capsules add background.
The system may require:
- Low-background capsules
- stable packing
- precise mass measurement
- repeated holder backgrounds
- longer averaging
- careful contamination control
However, when powder mass can be increased, the laboratory may improve SNR without purchasing the most extreme sensitivity configuration.
17. Bulk Ferromagnets Usually Favor Throughput
Bulk ferromagnetic samples commonly produce signals well above the lowest VSM detection limit.
Their workflow may prioritize:
- Fast mounting
- sufficient dynamic range
- strong mechanical support
- rapid field sweeps
- automated reports
- repeatable coercivity and remanence
- easy batch comparison
Extreme low-moment sensitivity may provide little practical value if every sample already produces a strong signal.
The buyer may obtain more value from:
- Better holders
- faster magnet ramping
- shorter settling
- automatic sample identification
- batch software
- easier maintenance
18. Permanent-Magnet Testing May Require Field and Dynamic Range
For hard magnetic samples, key requirements may include:
- Sufficient reverse field
- adequate saturation field
- high moment capacity
- strong holder
- correct demagnetizing correction
- repeatable sample orientation
- safe handling
The laboratory may care more about:
- Full-loop completion time
- magnet cooling
- field ramp rate
- sample loading
- consistent analysis
than about nanoemu-level sensitivity.
A sensitivity-first configuration should not reduce the sample mass or field capability needed for hard-magnet testing.
19. Soft Magnetic Samples Need Good Low-Field Performance
Soft magnetic materials may produce strong moments but have small coercive fields.
The measurement challenge may be:
- Residual magnetic field
- field offset
- field resolution
- magnet hysteresis
- zero-crossing behavior
- field-settling repeatability
The correct priority may therefore be neither maximum sensitivity nor maximum sample throughput.
It may be:
Accurate, repeatable low-field control with an efficient demagnetization workflow.
20. Screening and Research Use Different Data Standards
A screening measurement may answer:
- Is the sample magnetic?
- Is saturation moment within tolerance?
- Is coercivity above or below a threshold?
- Does the batch pass?
A research measurement may ask:
- Is there a weak secondary phase?
- Is exchange bias shifted by a small amount?
- Does high-field susceptibility change?
- Is a subtle transition reproducible?
- Can substrate background be separated confidently?
Screening needs fast and consistent decisions.
Research needs enough data quality to support interpretation and publication.
The system mode should match the decision being made.
21. Throughput Is More Than Measurement Speed
Total time per sample may include:
Ttotal = Tprepare + Tmount + Tcenter + Tbackground + Tfield + Taverage + Tanalyze + Texchange
Where:
- Tprepare = sample preparation time
- Tmount = holder installation time
- Tcenter = centering time
- Tbackground = background measurement time
- Tfield = magnetic-field ramp and settling time
- Taverage = signal acquisition time
- Tanalyze = data checking and reporting
- Texchange = removal and preparation for the next sample
Improving only Taverage may have little effect when sample mounting and centering dominate the cycle.
22. Points per Second Can Be Misleading
A high point-acquisition rate is useful for:
- Dense hysteresis loops
- FORC measurements
- rapid screening
- dynamic comparisons
But the useful rate may be limited by:
- Magnet ramping
- field settling
- sample vibration stability
- temperature stabilization
- software sequencing
- required SNR
Buyers should request the time required for a complete representative measurement—not only the fastest point-acquisition setting.
23. Define a Representative Hysteresis Loop
To compare throughput fairly, provide the same test sequence to every supplier.
Example:
- Start at zero field.
- ramp to +1 T.
- measure from +1 T to −1 T.
- return from −1 T to +1 T.
- use 401 measurement points.
- apply defined point density near coercivity.
- use the required averaging time.
- return to zero.
- export the calculated report.
Ask each supplier for:
- Ramp time
- acquisition time
- settling time
- total loop time
- expected noise
- number of samples achievable per day
24. Use Adaptive Field Spacing
Not every part of a hysteresis loop requires the same point density.
The software may use:
- Wider field steps near saturation
- smaller steps near coercivity
- finer steps near switching features
- additional points near zero field
Adaptive point spacing can improve throughput without removing scientifically important information.
The buyer should ask whether:
- Point regions can be configured.
- field spacing can change automatically.
- the original sequence is saved.
- different recipes can be stored by sample type.
25. Excessive Point Density Can Waste Time
More points do not automatically produce a better result.
An unnecessarily dense loop may create:
- Longer measurement time
- larger files
- more field reversals
- additional heating
- no meaningful improvement in extracted parameters
Point density should be selected according to:
- Coercive-field width
- switching behavior
- noise
- field accuracy
- analysis objective
Routine samples may use a shorter protocol than publication-critical samples.
26. Field Settling Can Dominate Slow Measurements
After each field step, the system may wait for:
- Power-supply current stability
- field-probe stability
- magnet hysteresis effects
- mechanical vibration
- sample relaxation
- temperature stabilization
The RFQ should ask:
- Is settling based on a fixed time?
- Is it based on a measured stability condition?
- What is the field tolerance?
- Can the threshold be changed?
- What happens if the field does not settle?
- Is settling time recorded in the raw data?
A fast detector cannot overcome a slow magnet or conservative settling algorithm.
27. Faster Field Sweeps May Not Suit Every Material
A rapid sweep may affect materials with:
- Magnetic viscosity
- thermal activation
- eddy currents
- slow domain processes
- relaxation effects
- temperature-sensitive behavior
The laboratory should separate:
- Fast screening loops
- quasi-static reference loops
- rate-dependent research loops
A throughput-focused system should still allow slower validated protocols when the material requires them.
28. FORC Measurements Are Highly Throughput-Sensitive
First-order reversal curve measurements can contain many field sweeps and large numbers of data points.
The total measurement time depends on:
- Number of reversal curves
- field range
- reversal-field spacing
- field-step spacing
- averaging time
- field ramping
- settling
- processing
A laboratory planning frequent FORC work should prioritize both:
- Sufficient sensitivity
- efficient large-dataset acquisition
Extreme sensitivity obtained only through very long averaging may make routine FORC measurements impractical.
29. Temperature-Dependent VSM Measurements Reduce Throughput
A variable-temperature experiment may require:
- Cooling or heating
- temperature ramping
- stabilization
- field loops at several temperatures
- holder background at temperature
- sample exchange
- safe warm-up
A ten-temperature study can take much longer than ten room-temperature loops because thermal stabilization becomes part of every measurement point or sequence.
The buyer should calculate throughput separately for:
- Room-temperature operation
- cryogenic operation
- high-temperature operation
30. Cryogenic Sample Exchange Can Become the Main Bottleneck
A cryogenic VSM sample change may include:
- Warm-up
- venting
- holder removal
- rewiring or remounting
- vacuum pump-down
- cooldown
- temperature stabilization
- recentering
In this workflow, detector speed may contribute only a small part of the total cycle.
A cryogenic laboratory may obtain more practical benefit from:
- Additional prewired holders
- faster sample exchange
- automated cooldown
- remote notifications
- reliable temperature sequences
than from a small improvement in room-temperature noise floor.
31. High-Temperature Measurements Have Similar Constraints
High-temperature VSM measurements may require:
- Special holders
- adhesives or cement
- vacuum or inert gas
- heater installation
- temperature stabilization
- controlled cooldown
- contamination checks
The system should be evaluated by:
- Time to operating temperature
- sample preparation
- usable sensitivity at temperature
- holder background
- atmosphere handling
- cleanup
- total sample-to-sample cycle
Room-temperature sensitivity claims should not automatically be applied to high-temperature configurations.
32. ZFC and FC Sequences Are Time-Intensive
Zero-field-cooled and field-cooled measurements may require:
- Magnet degaussing
- residual-field verification
- cooling in a defined condition
- application of field at a selected temperature
- controlled warming
- repeat measurement
- another cooldown
The laboratory should estimate how many such sequences are expected each month.
If they are frequent, automation and unattended operation may provide greater value than a marginal sensitivity improvement.
33. Automation Improves Effective Throughput
Useful automation may include:
- Sample centering
- field sequences
- temperature sequences
- ZFC and FC protocols
- background subtraction
- gain selection
- range changes
- report generation
- alarm handling
- unattended overnight runs
- remote notifications
Automation reduces:
- Operator waiting
- inconsistent procedures
- missed steps
- repeated setup
- transcription errors
The value is not only faster measurement.
It is more reliable use of laboratory time.
34. Stored Recipes Reduce User Variation
A shared VSM may be operated by:
- Professors
- postdoctoral researchers
- graduate students
- technicians
- visiting users
Stored recipes can standardize:
- Field range
- field spacing
- averaging
- centering
- background
- temperature
- analysis
- report format
A screening laboratory should not depend on every user manually rebuilding the same sequence.
35. Fast Sample Holders Can Be More Valuable Than Extreme Sensitivity
A high-throughput holder should support:
- Quick mounting
- clear orientation
- repeatable position
- minimal tools
- low magnetic background
- easy cleaning
- known sample limits
- spare holders for parallel preparation
Multiple holders allow the next sample to be prepared while the current sample is measured.
This reduces expensive instrument idle time.
36. One Holder Rarely Serves Every Sample Well
Different samples may need:
- Thin-film holder
- bulk holder
- powder capsule
- permanent-magnet fixture
- cryogenic holder
- high-temperature holder
- angular holder
A universal holder may compromise:
- Background
- mechanical stability
- sample capacity
- centering
- exchange speed
The quotation should include the holders required for the laboratory’s main sample classes.
37. A Three-Mode VSM Strategy
Many laboratories can avoid an all-or-nothing decision by using three measurement modes.
Mode 1: Fast Screening
Designed for:
- Strong signals
- fewer field points
- shorter averaging
- quick pass/fail decisions
- high sample volume
Mode 2: Standard Research
Designed for:
- Routine publication data
- balanced averaging
- controlled centering
- normal background subtraction
- moderate field-point density
Mode 3: High Sensitivity
Designed for:
- Weak thin films
- low-mass nanoparticles
- subtle loop features
- longer averaging
- slower field sequence
- repeated backgrounds
- stricter stability checks
The buyer should ask whether these modes can be stored as validated recipes.
38. Tier 1: Throughput-First VSM Configuration
A throughput-first system may prioritize:
- Room-temperature operation
- quick sample exchange
- automated centering
- strong-signal dynamic range
- fast bipolar field sweeps
- simple holders
- batch software
- automatic reporting
- low operator workload
Suitable applications may include:
- Routine powder comparison
- permanent-magnet screening
- process control
- incoming material inspection
- strong bulk samples
- teaching laboratories
The system still needs good repeatability and valid calibration.
It simply avoids paying for sensitivity the samples do not require.
39. Tier 2: Balanced Research VSM Configuration
A balanced system may prioritize:
- Good low-moment capability
- reasonable measurement speed
- several holders
- room-temperature and variable-temperature options
- flexible field sequences
- raw-data access
- automated centering
- standard background tools
- APIs or scripting
This is often suitable for university materials laboratories measuring a mixed sample portfolio.
The key is sufficient flexibility without forcing every sample through the slowest possible protocol.
40. Tier 3: Sensitivity-First VSM Configuration
A sensitivity-first system may prioritize:
- Lowest practical noise
- high mechanical stability
- precision sample centering
- low-background holders
- long averaging
- stable magnetic field
- environmental isolation
- repeated background measurements
- reference standards
- advanced raw-data analysis
Suitable applications may include:
- Ultra-thin magnetic films
- dilute magnetic systems
- low-mass nanostructures
- weak temperature-dependent transitions
- subtle exchange-bias measurements
This configuration may reduce daily sample capacity.
That trade-off is acceptable when weak-signal capability is the primary scientific requirement.
41. One VSM Can Serve Different Workflows—Within Limits
One configurable VSM may support both screening and high-sensitivity work when it offers:
- Wide dynamic range
- adjustable averaging
- configurable field spacing
- several gain ranges
- stable sample positioning
- interchangeable holders
- stored recipes
- flexible software
- raw-data access
However, one system may still become a scheduling bottleneck when:
- Screening volume is high.
- weak-sample runs last many hours.
- cryogenic studies occupy the system for days.
- different groups require simultaneous access.
In those cases, separate screening and research platforms may provide better total productivity.
42. When Two Platforms Make More Sense
Separate systems may be justified when:
- Dozens of strong samples require routine screening.
- only a small subset needs high-sensitivity research.
- cryogenic experiments block room-temperature work.
- production users and research users have different schedules.
- one system failure must not stop all measurements.
- the required field or sample geometry differs greatly.
A practical structure may be:
Platform A
Fast room-temperature screening VSM.
Platform B
Research VSM with low-moment, cryogenic, angular, or advanced analysis options.
The purchase cost is higher, but laboratory scheduling may improve substantially.
43. Estimate Annual Capacity Before Buying
Use a simple model:
Annual sample capacity = available measurement hours ÷ average hours per completed sample
Suppose a laboratory has 1,500 available system hours per year.
Sensitivity-First Workflow
- Average total time: 3 hours per sample
- theoretical capacity: 500 samples per year
Balanced Workflow
- Average total time: 1 hour per sample
- theoretical capacity: 1,500 samples per year
Screening Workflow
- Average total time: 20 minutes per sample
- theoretical capacity: 4,500 samples per year
These are illustrative planning figures.
Real capacity should include:
- Maintenance
- failed runs
- training
- setup
- calibration
- holidays
- cryogenic cycles
- scheduling gaps
44. Calculate Cost per Valid Dataset
The cheapest instrument is not necessarily the lowest-cost system.
A useful calculation is:
Cost per valid dataset = annual ownership and operating cost ÷ annual valid datasets
Include:
- Equipment depreciation
- maintenance
- calibration
- chiller or cryogen use
- operator time
- sample holders
- failed runs
- remeasurement
- downtime
A sensitivity-first system may have a higher cost per routine sample but a lower cost per successful weak-signal publication dataset.
A throughput-first system may be economical for batch work but unable to answer advanced research questions.
45. Consider the Cost of False Decisions
Insufficient sensitivity may create:
- False negatives
- missed weak magnetic phases
- incorrect comparison of thin films
- unreliable coercivity extraction
- repeated measurements on another instrument
Insufficient throughput may create:
- Long queues
- delayed projects
- rushed measurements
- skipped replicates
- outsourcing costs
- underused sample-development capacity
The procurement decision should account for both scientific and operational consequences.
46. Reference Materials Support Confidence, Not Throughput Alone
Reference samples help verify:
- Magnetic-moment scale
- measurement consistency
- gain ranges
- system stability
- performance after service
- interlaboratory comparison
NIST provides magnetic-moment and susceptibility reference materials for magnetometer calibration, including materials intended for different VSM and SQUID measurement ranges. A laboratory should select reference checks that represent the moment range and measurement mode it actually uses.
A quick reference check can protect throughput by identifying a system problem before an entire batch is measured incorrectly.
47. Build a Reference-Check Schedule
A laboratory may perform:
Daily or Before-Batch Check
- Strong stable reference
- short standard loop
- polarity confirmation
- basic moment check
Weekly Check
- Repeatability
- centering
- holder background
- low-field behavior
Periodic Research Check
- Low-moment reference
- full field range
- temperature option
- remounting reproducibility
- calibration review
The frequency should reflect:
- Use intensity
- measurement risk
- sample value
- maintenance history
48. Compare Sensitivity Claims Using One Test Protocol
Ask each supplier to perform or describe the same test.
Example:
- Room temperature
- specified pole gap
- specified holder
- zero or defined magnetic field
- fixed acquisition duration
- fixed averaging
- repeated readings
- RMS or standard-deviation calculation
- raw time-series data
- environmental conditions
Without a common protocol, the buyer may compare:
- RMS noise with peak-to-peak noise
- one-second averaging with ten-second averaging
- empty-holder data with processed sample data
- room-temperature data with cryogenic data
These are not equivalent.
49. Compare Throughput Using One Complete Workflow
Provide suppliers with one representative sample scenario.
Example:
“Measure a 10 mm × 10 mm thin-film sample from +1 T to −1 T and back to +1 T using 401 field points, normal background subtraction, automatic centering, and the averaging required to achieve the stated SNR.”
Ask for:
- Mounting time
- centering time
- background time
- field-ramp time
- acquisition time
- processing time
- total sample-to-report time
- operator-attended time
- unattended time
This is more informative than the fastest published acquisition rate.
50. FAT Should Include Both Sensitivity and Throughput
A balanced Factory Acceptance Test may include:
Sensitivity Test
- Empty-holder or low-moment reference
- defined averaging
- defined field
- repeated readings
- raw noise data
- stated calculation
Strong-Signal Loop
- Representative bulk or reference sample
- complete hysteresis loop
- total measurement time
- extracted parameters
Weak-Signal Loop
- Low-moment sample
- background subtraction
- SNR evaluation
- longer averaging mode
Remounting Test
- Remove and reinstall the reference sample
- repeat centering
- repeat the loop
- compare results
Workflow Test
- Record total time from one sample to the next
51. Sensitivity FAT Should Avoid One Best-Case Number
Request several results, such as:
- Short averaging
- standard averaging
- long averaging
- empty holder
- low-moment sample
- different field conditions
- repeated measurements
This shows how performance changes with measurement time.
It also allows the buyer to design practical screening and research modes.
52. Throughput FAT Should Use the Delivered Holders
A supplier may demonstrate fast measurement using:
- A simple strong sample
- a factory reference holder
- a pre-centered sample
The buyer’s normal workflow may involve:
- Thin-film mounting
- powder capsules
- angular holders
- cryogenic holders
- substrate subtraction
Throughput should be evaluated using the actual or representative delivered configuration.
53. Ask for Raw Data and Time Stamps
Raw files should preserve:
- Sample ID
- time
- field setpoint
- field readback
- magnetic moment
- temperature
- gain range
- averaging
- sample position
- centering result
- background file
- processing settings
Time stamps allow the buyer to determine:
- Actual field-ramp time
- settling time
- acquisition time
- interruptions
- total sequence duration
54. Software Should Preserve Measurement Modes
Each result should identify whether it was collected in:
- Screening mode
- standard mode
- high-sensitivity mode
- cryogenic mode
- high-temperature mode
- FORC mode
- relaxation mode
This prevents data collected under different averaging and field protocols from being compared without context.
55. Report Speed and Data Quality Together
An automatic report should include:
- Sample information
- holder
- field sequence
- temperature
- averaging
- moment units
- normalization basis
- background method
- extracted parameters
- data-quality status
A fast report is not useful when it hides the conditions that produced the result.
56. Questions Buyers Should Answer Before Requesting a Quote
Sample Portfolio
- What sample types will be measured?
- What are their dimensions and masses?
- What are the weakest and strongest expected moments?
- How many samples are expected per week?
- Which samples require publication-quality data?
Sensitivity
- What is the minimum useful sample signal?
- What SNR is required?
- Is substrate or holder background significant?
- What measurement time is acceptable?
- Is remounting reproducibility important?
Throughput
- How many completed samples are required per day?
- What is the maximum acceptable sample-to-report time?
- How much operator involvement is acceptable?
- Are overnight unattended measurements required?
- Are several users sharing the system?
Magnetic Field
- What field range is needed?
- What is the expected coercivity?
- What is the required field-step density?
- Is low-field accuracy important?
- Are rapid sweeps acceptable?
Temperature
- Is room-temperature operation sufficient?
- What minimum and maximum temperatures are required?
- How many temperature points are typical?
- Are ZFC or FC sequences required?
- What sample-exchange time is acceptable?
Workflow
- Is automatic centering required?
- How many holder types are needed?
- Is background subtraction routine?
- Are batch reports needed?
- Are APIs or scripts required?
57. Better RFQ Language
Instead of writing:
“We need a highly sensitive and fast VSM.”
write:
“We require a VSM for two measurement workflows.
The routine screening workflow will measure bulk and powder samples with expected moments from approximately 10⁻³ to 1 emu. The target throughput is at least eight completed room-temperature samples per working day, including mounting, centering, a full ±1 T hysteresis loop, basic analysis, and report export.
The research workflow will measure thin-film samples with expected net moments down to approximately 10⁻⁶ emu after substrate subtraction. Please state the noise level and expected SNR under short, standard, and long averaging conditions. Raw repeated data and the exact test conditions shall be provided.
The quotation should include automated sample centering, low-background thin-film and powder holders, stored screening and high-sensitivity recipes, configurable field-point density, raw-data export, remounting repeatability tests, and a reference sample.
Please state the complete measurement time for one representative screening loop and one representative high-sensitivity loop, including field ramping, settling, averaging, centering, and processing.”
58. VSM Sensitivity vs Throughput Comparison Matrix
| Evaluation Item | Sensitivity-First | Balanced | Throughput-First |
|---|---|---|---|
| Weakest sample | Ultra-low moment | Low to medium moment | Medium to high moment |
| Averaging | Long | Adjustable | Short |
| Field points | Dense | Configurable | Optimized/minimal |
| Centering | Precision | Automated | Fast automated |
| Background | Frequent detailed measurement | Stored and verified | Standardized |
| Sample holders | Lowest background | Multiple flexible holders | Quick-change |
| Temperature | Research options | Optional/modular | Often room temperature |
| Automation | Long unattended runs | Flexible recipes | Batch workflow |
| Samples per day | Low | Medium | High |
| Main value | Data quality | Flexibility | Productivity |
This matrix should be adjusted to the laboratory’s real samples.
59. How to Score Competing VSM Quotations
A weighted evaluation may include:
| Category | Example Weight |
|---|---|
| Minimum useful moment and SNR | 18% |
| Measurement repeatability | 12% |
| Remounting reproducibility | 8% |
| Complete sample throughput | 15% |
| Magnetic field performance | 12% |
| Holders and sample workflow | 10% |
| Temperature options | 8% |
| Software and automation | 8% |
| FAT evidence | 5% |
| Service and documentation | 4% |
The weights should change depending on the application.
A production laboratory may assign more weight to throughput.
A thin-film research laboratory may assign more weight to sensitivity and background control.
60. Common Buyer Mistakes
Mistake 1: Requesting the Lowest Possible Detection Limit
The laboratory may pay for sensitivity it never uses.
Mistake 2: Comparing Noise Without Averaging Conditions
The figures may represent very different measurement times.
Mistake 3: Equating Points per Second with Sample Throughput
Mounting, centering, field settling, and processing may dominate.
Mistake 4: Ignoring Holder and Substrate Background
Practical sensitivity may be much worse than the instrument-only noise.
Mistake 5: Measuring Every Sample in High-Sensitivity Mode
Strong samples may not need long averaging or dense field spacing.
Mistake 6: Using One Fast Protocol for Every Research Sample
Weak or complex samples may require more careful measurement.
Mistake 7: Ignoring Remounting Reproducibility
Daily results depend on holder and centering performance.
Mistake 8: Adding Cryogenic Options Without Calculating Throughput
Thermal cycles can dominate total experiment time.
Mistake 9: Buying One Platform for Two Incompatible Workloads
High-volume screening and long-duration weak-signal research may compete for access.
Mistake 10: Testing Only Sensitivity During FAT
The complete sample workflow should also be demonstrated.
61. How Cryomagtech Supports VSM Configuration Planning
Cryomagtech supplies VSM systems and related magnetic characterization solutions, including:
- Electromagnets
- bipolar excitation power supplies
- field probes
- gaussmeters
- water chillers
- room-temperature sample holders
- thin-film fixtures
- powder holders
- cryogenic temperature controllers
- low-temperature options
- high-temperature options
- software and data-acquisition solutions
- custom Magnet & Field Systems
For VSM projects, we help buyers evaluate:
- Expected magnetic-moment range
- minimum useful signal
- SNR requirements
- sample throughput
- sample mounting and exchange
- automatic centering
- holder and substrate background
- magnetic field range
- low-field performance
- field ramping and settling
- averaging modes
- screening and research recipes
- room-temperature and cryogenic workflows
- temperature-dependent sequences
- raw-data and software requirements
- reference samples
- FAT sensitivity tests
- FAT throughput tests
- configuration tiers and upgrade options
The best VSM is not automatically the instrument with the lowest published noise floor.
It is the system that produces sufficiently reliable data within a measurement workflow the laboratory can actually sustain.
References
- Lake Shore Cryotronics — Noise Performance for Samples Measured in the 8600 Series VSM
https://www.lakeshore.com/home/blog/posts/blog/2025/09/12/app-brief–noise-performance-for-samples-measured-in-our-8600-series-vsm - NIST — Magnetic Moment and Susceptibility Standard Reference Materials
https://www.nist.gov/mml/materials-science-and-engineering-division/magnetic-moment-and-susceptibility-standard-reference
Key Takeaways
- VSM sensitivity and VSM throughput are different performance goals.
- Sensitivity must be stated with averaging, bandwidth, field, temperature, holder, and background conditions.
- Throughput should be measured from sample preparation to validated report—not only by data points per second.
- Longer averaging can improve weak-signal measurements but reduces sample capacity.
- Sample centering, holder background, field settling, and sample exchange may dominate total measurement time.
- Thin films and low-mass samples often justify a sensitivity-first configuration.
- Strong bulk samples, permanent magnets, and routine screening often benefit more from throughput and repeatability.
- Cryogenic and high-temperature measurements require separate throughput calculations.
- Stored screening, standard, and high-sensitivity recipes can allow one VSM to serve several workflows.
- Separate screening and research platforms may be justified when both workloads are heavy.
- Reference materials and routine checks help prevent entire batches from being measured incorrectly.
- FAT should test sensitivity, remounting reproducibility, complete loop time, and sample-to-sample workflow.
- Competing quotations should report both weak-signal performance and representative sample throughput under defined conditions.
For VSM procurement, the key question is not only:
“How low is the VSM’s noise floor?”
The better question is:
“What level of sensitivity is genuinely required for our weakest samples, and how many valid measurements can the laboratory complete when mounting, centering, background subtraction, field control, temperature, and analysis are all included?”